
~3 min read
Python as the Glue Layer for AI-Augmented Analytics
A Streamlit demo showing how Python can connect business questions, metadata, AI-generated SQL, validation and analytical explanation in one lightweight workflow.
A few weeks ago, I built a small Streamlit app as the centrepiece of a Python class I taught at university. On the surface, it is just a slide deck written in Python — a sequence of scenes that walks the audience from a business question to a SQL query, a guardrail check, an execution against a mock warehouse and a short business-language summary.
But the app is really about a broader shift in analytics. Python is no longer just a tool for scripts, notebooks and data cleaning; combined with AI-assisted coding, it becomes a practical glue layer between business questions, metadata, SQL, validation, data products and explanation.
You can try the demo here: python-prezentacja.streamlit.app.
The demo, in one paragraph
The app takes a simple business question — “Which customers were most profitable last quarter?” — and pushes it through a small pipeline: combine it with business metadata, ask a mocked LLM to produce SQL, validate that SQL against a set of guardrails, execute it against a mock warehouse, and finally return both a table and a short natural-language summary. The whole thing runs in the browser, in Python, without leaving Streamlit.
There is nothing exotic in the code. The pipeline is built out of four ingredients anyone who has finished an introductory Python course already knows: dictionaries, functions, if statements and pandas. It is a teaching prototype rather than a production architecture; the goal is to make the shape of the workflow visible.
If you open the demo, pay attention to three moments: the ambiguous business question, the metadata-enriched prompt, and the guardrail check before SQL execution. Those three moments are the real argument of the app.
Python is no longer just a scripting language
For a long time, the default image of Python in analytics was either a Jupyter notebook used for an ad-hoc analysis, or a short script that loads a CSV, transforms it and writes another CSV.
With AI-assisted coding (Copilot, Claude, Cursor, whichever tool you prefer), the cost of going one level beyond that has collapsed. A handful of functions, a Streamlit front end and a couple of API calls is now a reasonable weekend project for a business analyst, not a multi-week engineering effort.
That changes what Python is, organisationally. It stops being a niche tool for data scientists and starts behaving as a thin integration layer between:
- a business user asking a question in natural language,
- a model that can translate language into SQL, DAX or code,
- a data warehouse or semantic layer that actually holds the numbers,
- a validation step that decides whether the generated output is safe to run,
- and a presentation step that turns rows into something a stakeholder can read.
The demo is a four-hundred-line argument that this layer can be built with the Python you already know.
”Most profitable” is not a question. It is three questions.
The most useful slide in the deck, judging by how the room reacted, is the one where the same business question, “Which customers were most profitable last quarter?”, produces three different winners depending on how profitable is defined:
- if profitable means net revenue, one customer wins;
- if it means gross profit in PLN, another wins;
- if it means gross margin percentage, a third wins.
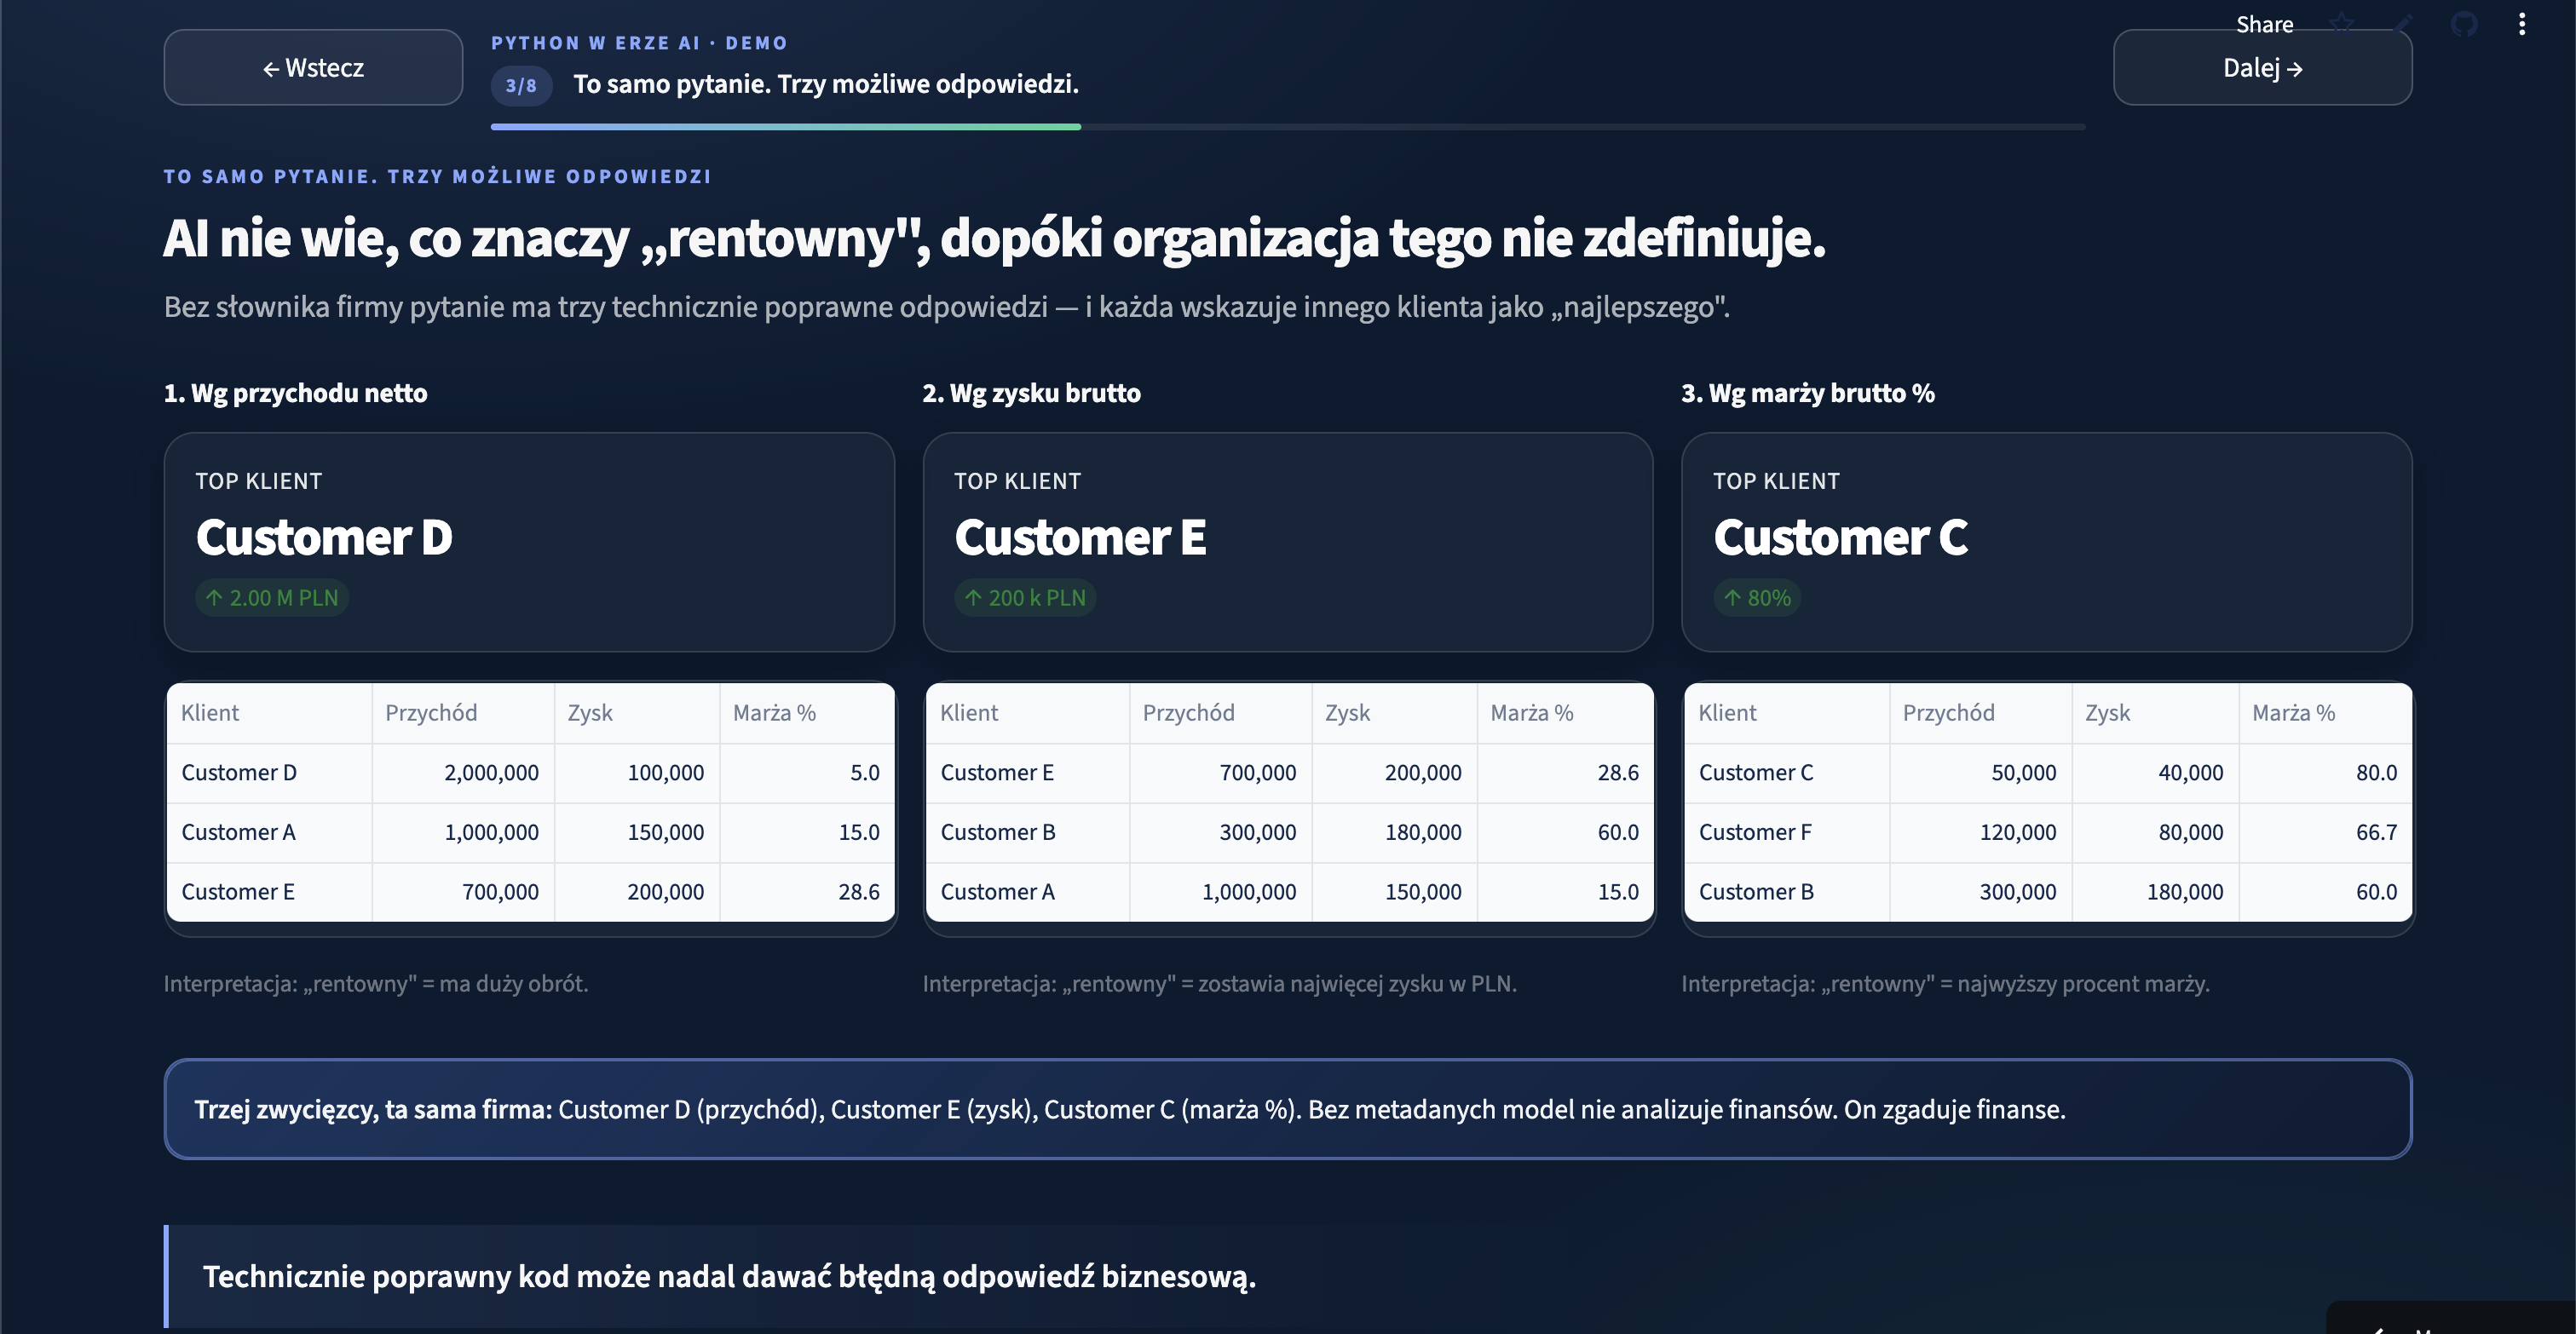
All three answers are technically correct, and an LLM could produce any of them with a straight face. Only one is the answer the finance team actually wants, and the model cannot know which one without being told.
This is the part of AI-augmented analytics that is easy to under-rate from the outside. Generating SQL is the easy part. The hard part is making sure the generated SQL reflects the organisation’s actual definitions of customer, profitable, last quarter, revenue and cost.
Without that, AI does not analyse finance. It guesses finance, fluently.
Metadata is the part that makes the model trustworthy
In the demo, the difference between an ambiguous answer and a defensible one is a small dictionary of business definitions:
- Customer — the entity invoiced in a given quarter.
- Profitable — ranked by
gross_profit, with margin percentage as a supporting measure rather than the ranking key. - Last quarter — the most recent fully closed calendar quarter.
- Revenue —
net_revenue, excluding VAT and after invoice corrections. - Cost —
direct_service_cost, excluding overheads. - Small customers — under 100k PLN, excluded from margin-based rankings to avoid misleading percentages.
Once those definitions are part of the prompt, the model has much less room to guess. The ambiguity that produced three different winners collapses into one ranking logic, one that is easier to inspect, repeat and challenge. Anyone running the same question against the same metadata should arrive at the same business definition of the answer.
This is the claim I keep coming back to in my own work:
Metadata quality is not a documentation problem. It is a control surface for AI-augmented analytics.
The cleaner and more authoritative the definitions, the more of the model’s output you can actually evaluate and trust. It also flips a common intuition. People often assume that AI makes metadata less important, because the model can “figure things out”. In my experience the opposite happens: AI raises the cost of weak metadata, because weak definitions now produce fluent but wrong answers at scale instead of silent failures that one analyst can catch.
Two layers of trust: guardrails and measurement
Trust in an AI-assisted analytical system does not come from a single check. The demo splits it into two layers, and I think both are necessary in real deployments.
Layer one — per-query guardrails. Before any generated SQL touches the warehouse, a small validator inspects it: is it SELECT-only? Does it filter the right time window? Does it reference allowed tables? Does it match the expected shape for the question being asked? In the demo, this is handled with simple if statements. In production, the same idea would require proper parsing, permissions, query limits and logging. The principle stays the same either way: generated analytics needs deterministic checks before execution.
Layer two — fleet-level measurement. A single safe query tells you very little. What you actually want to know is: across hundreds or thousands of questions, how often does the agent produce something a human would accept as correct? In the demo, this is a pandas dataframe of agent logs, split by metadata quality, with a simple failure-rate chart. In production, it is the same idea with more rigour: a continuous audit of agent behaviour, treated with the same seriousness as a financial audit.
Neither layer is exciting to build, but real deployments need both.
What this implies for BI teams
If I project the demo forward, past mock data and into the real systems I work with, the implication for BI teams is neither “AI will replace us” nor “AI changes nothing”. It is quieter than both.
The job shifts from manually producing every report toward designing the environment in which trustworthy reports can be produced — by analysts, by business users, and, increasingly, by agents acting on their behalf.
That environment is mostly made of unglamorous things: clear metric definitions, a maintained semantic layer, documented ownership, a small set of guardrails, and a measurement system that tells you when the agents drift. The fun part — generating SQL, drawing charts, writing summaries — is what is becoming cheap.
Python sits in the middle of this picture, not as a replacement for the warehouse or the BI tool but as the thin, scriptable, AI-friendly layer that ties them together. For a class full of students who had just learned about dictionaries and if statements, that was a surprisingly motivating ending.
For me, it is the working assumption behind most of what I am writing about next:
AI will make analytical output easier to generate, and trustworthy analytical environments both harder and more important to design.