When I was 13, I had a small existential crisis while finishing yet another novel. I had worked out, roughly, how many books I could read if I kept going at the same pace for the rest of my life. Then I looked at the shelves around me and realised the numbers didn’t even come close. Most of the books that might have changed the way I saw the world were books I would never get to open.
I kept reading more and more, but somehow, it never felt like enough. No matter how much I read, there was always more to discover — more knowledge, more stories, more fascinating ideas. My curiosity seemed limitless, but my time wasn’t.
I had almost forgotten that feeling until a few weeks ago, when I found myself looking at two investment dashboards I hadn’t built. Both had been generated from the same dataset and the same request, in less time than it takes me to clear my inbox on a Monday morning. Both looked better than most dashboards I’ve shipped in my career.
And I realised I had no idea how long it would take me to figure out whether either of them was actually right.
That gap is what this essay is about. AI has radically lowered the cost of producing an answer that looks credible. It has not lowered, by anything like the same amount, the cost of finding out whether the answer is true.
When prototypes were expensive on purpose
For most of my career, a dashboard started as an argument.
Someone in finance or operations had a question, usually a vague one. We turned it into a mockup, first on a whiteboard and later in Figma. We debated which KPI deserved the top-left corner, sketched charts using made-up numbers, and walked stakeholders through the proposed design.
We could often put together an initial mockup in a single interactive session, then refine it over several rounds of feedback, incorporating different perspectives and challenging assumptions along the way.
Only when someone senior finally said, “Yes, let’s build this,” did we move on to working with real data.
I used to see that phase as overhead. Looking back, it was a filter. Because building was expensive, someone had to decide whether the thing was worth building, and people argued about definitions before the code existed. What counts as revenue? Is this the cheapest price or the average? The meetings were where meaning got negotiated.
I don’t want to romanticise it, though. Those mockups also lied, in a very specific way: they ran on invented numbers. A Figma screen can’t show you that the data has a hole in it. That turns out to matter for this story.
Today the filter is gone. A single prompt takes you from a business request to a working, interactive, visually confident application. I wanted to see what fills the space where the filter used to be.
The experiment
I wanted data that was real, public and messy enough to be honest. I used a published dataset of historical LEGO prices from the Polish price-comparison site PromoKlocki: monthly prices for about 8,400 sets from June 2018 to June 2023, released with a peer-reviewed data paper (Oczkoś et al., 2024, Data in Brief). It is a small, real market where people genuinely ask “is this a good time to buy?”
Then I played a character: an ambitious but slightly lazy FP&A manager who wants to impress the CFO. My brief was roughly make it beautiful, make it decision-driven, don’t make me explain which charts to use. I asked an AI to turn it into a structured prompt, and got back a demanding, well-written specification, complete with “non-negotiable analytical standards”. The brief and the prompt took me about 20 minutes.
I gave the same prompt and the same file to two tools: Claude Opus 5.5, working as an agent with access to my project folder, and Codex on its default settings. Both could see my earlier notes on the dataset’s quirks. Both Claude and Codex produced a working dashboard in about 5 minutes.
This is one prompt, one dataset and one run per tool. It is an illustration, not a benchmark, and I won’t crown a winner. What interested me was what any such output asks of the person who receives it.
What came back
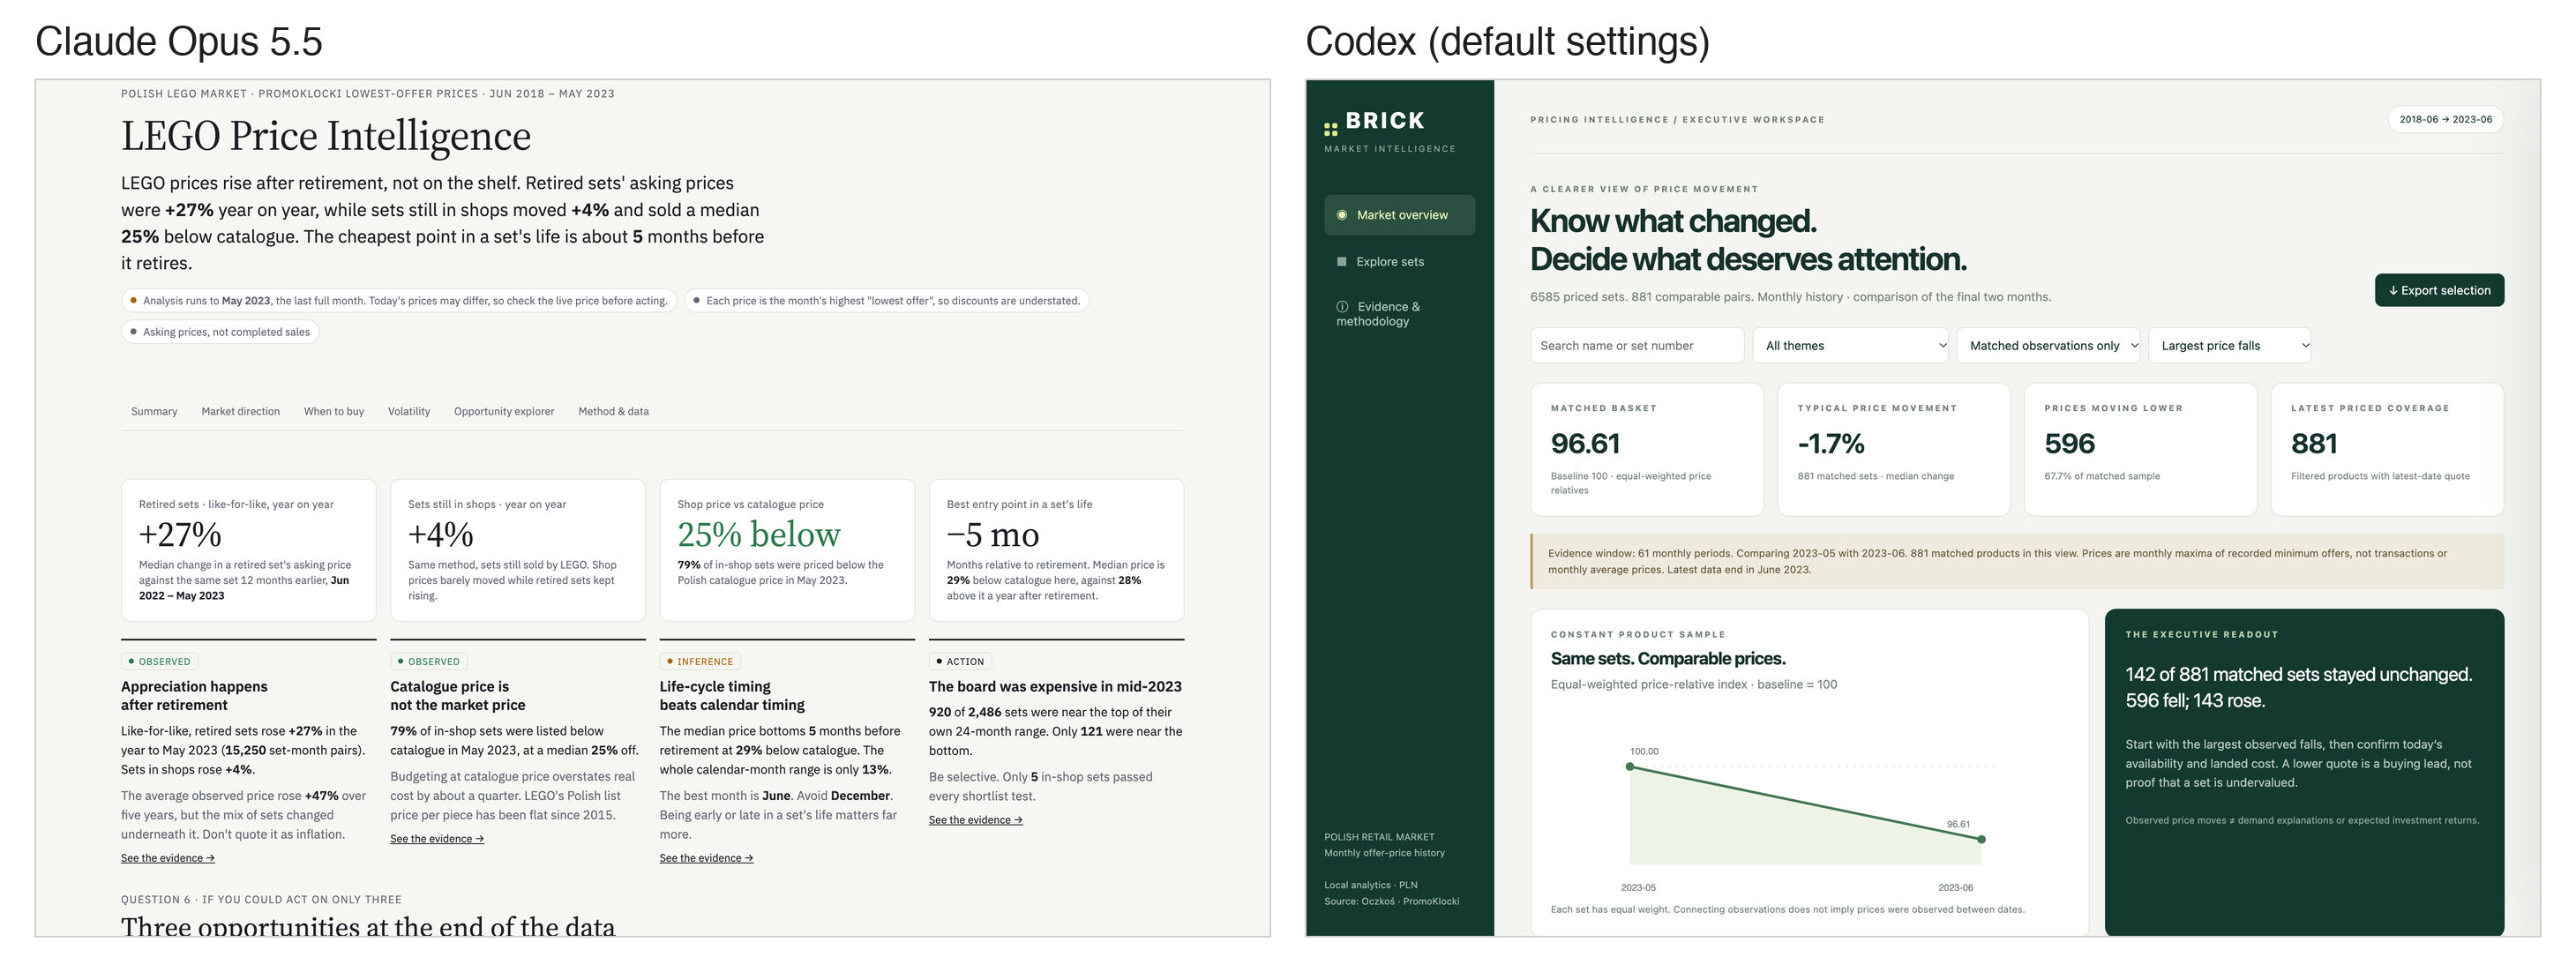
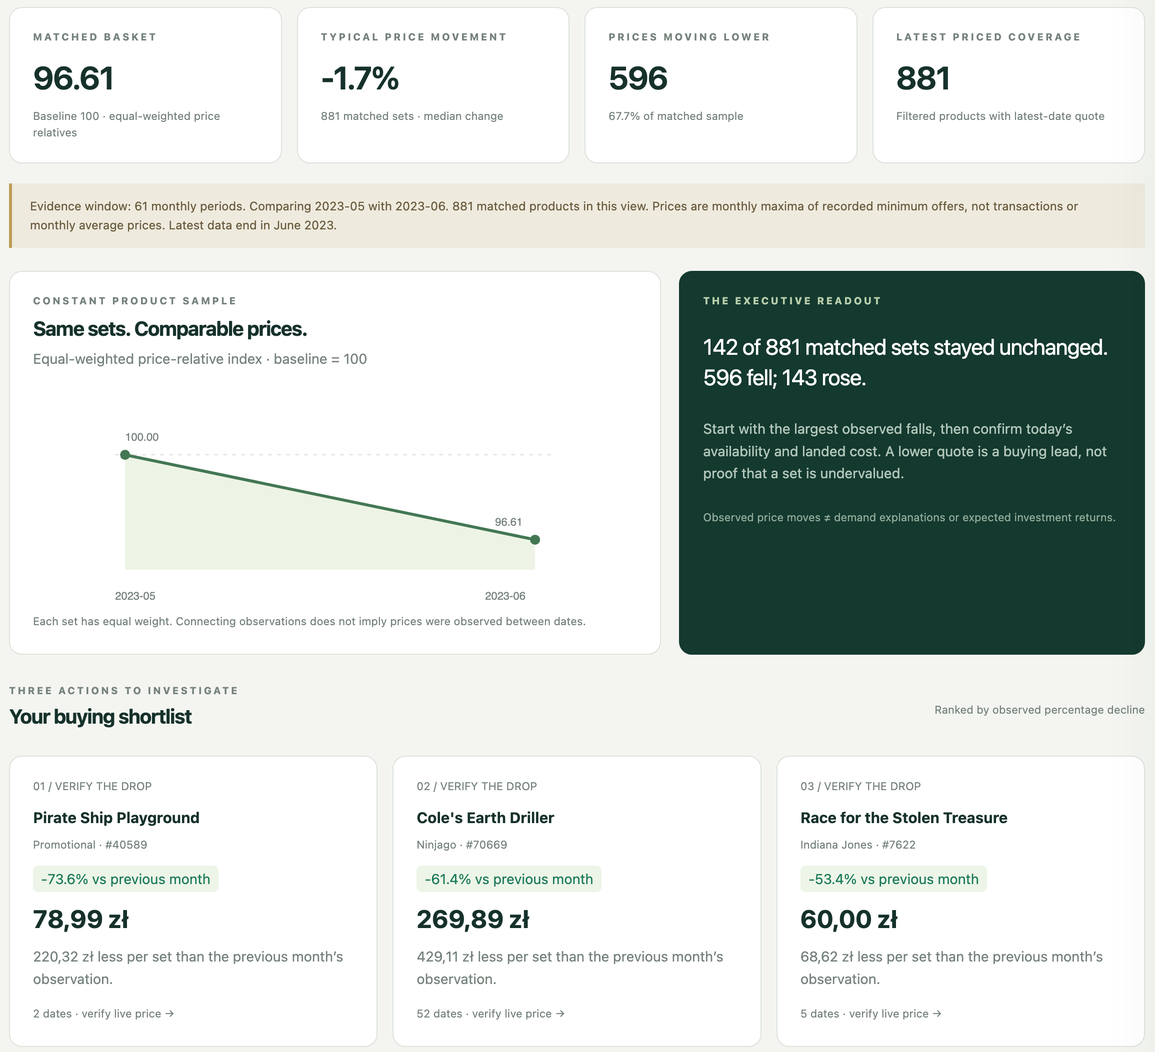
Codex built a calm, compact executive workspace: a sidebar, a headline index and four KPI tiles. It compared the last two months in the data and ranked the sets whose prices fell the most. Its tone was careful. The methodology section explains that prices are monthly maxima of the lowest offers and calls the shortlist “a triage tool, not an undervaluation score”. Its headline figures said prices were moving lower: a typical change of −1.7%, with 596 of 881 matched sets falling.
Claude built something closer to an analyst’s report, using all five years of data, with sections on market direction, timing, volatility, an opportunity explorer and a scoring formula. It argued that LEGO prices rise after a set is retired rather than on the shelf, that sets still in shops sell about a quarter below catalogue price, and that the cheapest moment in a set’s life is about five months before retirement. Every claim carried a label: Observed, Inference, Hypothesis or Action.
There was also a smaller story about access. Claude’s first version only showed its data to signed-in users, so a CFO opening the link would have seen “Nothing on this dashboard yet”. Codex published to a public web address without anyone deciding the data should be there. Neither tool raised either point. That is the gap between a working prototype and a production-ready analytical product: AI cut development to minutes, but access, permissions, security, data certification and ownership were all still open questions.
These outputs are easiest to judge on three separate scales, because the scales don’t move together:
Presentation
Does it look credible, and is it easy to read?
Both strong. Codex cleaner and calmer, Claude denser and more narrative.
Analytical correctness
Are the numbers right, and do the comparisons mean what they claim?
Both careful in their wording. Both had a flaw a 10-second glance would never catch (below).
Decision usefulness
Would it change what someone does on Monday?
Codex: a list of recent price drops to “verify”. Claude: a timing rule and a shortlist, partly built on the flaw.
If I had been the CFO, I would have been impressed by both. That is exactly the problem.
The month nobody checked
Here is the detail that changed how I think about the whole exercise.
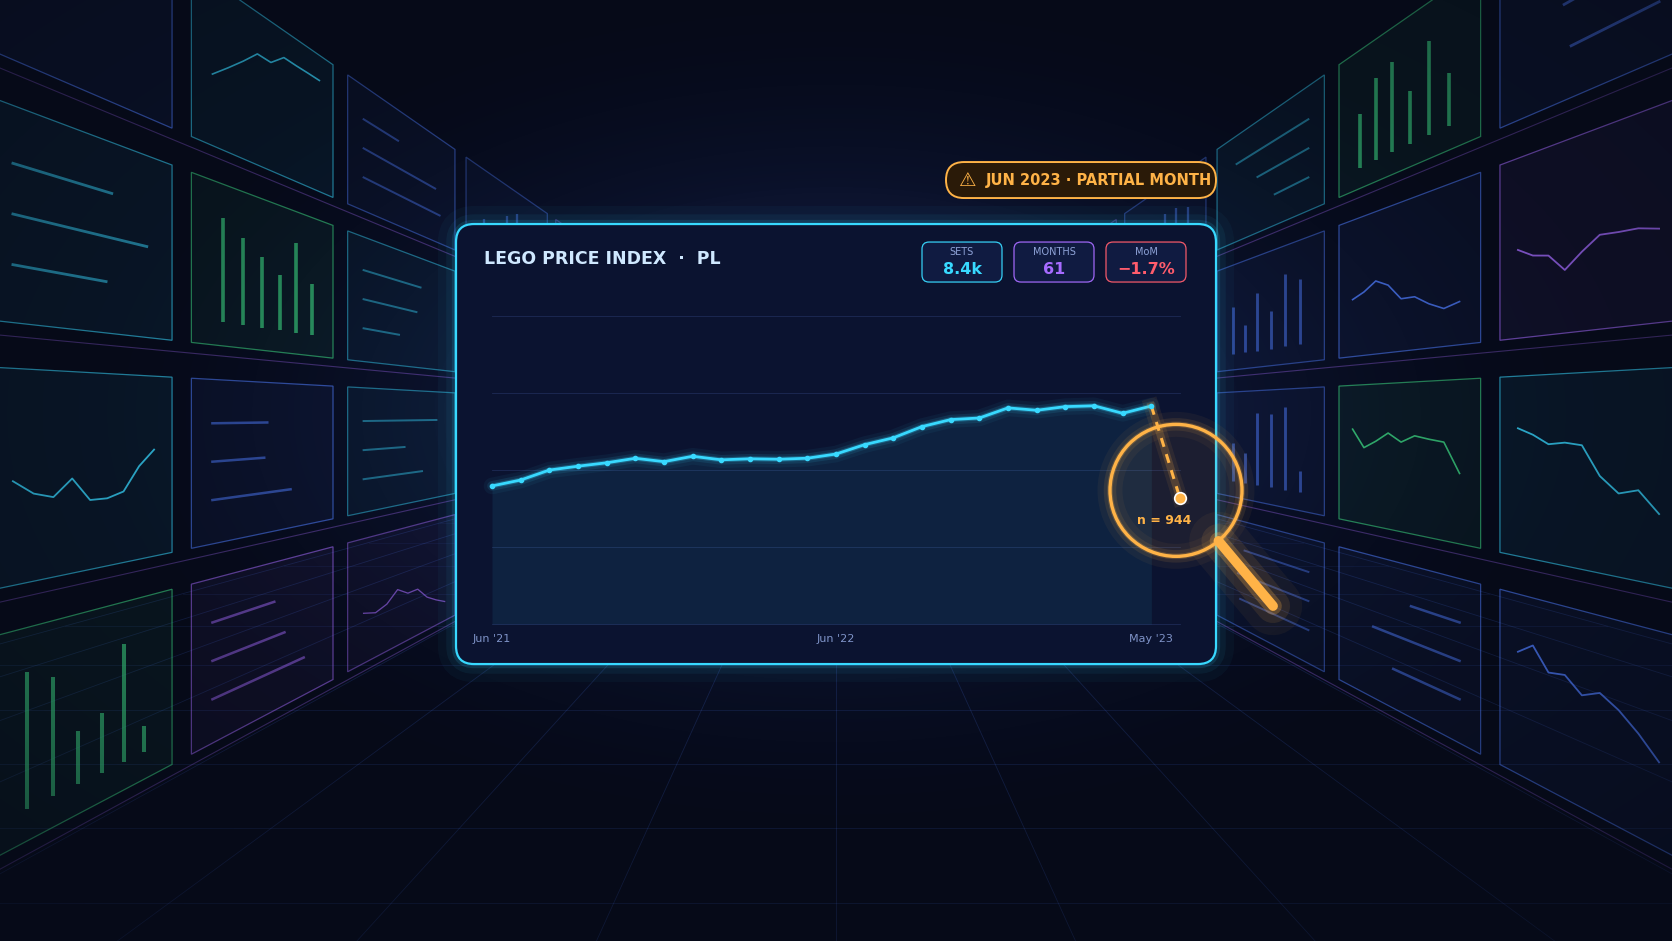
The dataset does not store an average price per month. It stores the highest value of the lowest available offer during the month, a quirk of how it was collected. Both tools knew this, and both wrote it down. What neither of them flagged is that the last month in the file, June 2023, is incomplete. The collection stopped partway through, and June has about a third of the usual records.
A maximum taken over half a month is lower than a maximum over a full month, for purely mechanical reasons: fewer price points mean fewer chances for a high one. So May to June is likely to look like a fall even if nothing happened. In the other recent month pairs I checked, the median set’s price didn’t move and between 34% and 46% of sets got cheaper. From May to June 2023, the median fell by 1.5% and 67% of sets got cheaper, while the number of sets that could be compared dropped from about 2,400 to 944.
The data alone can’t separate how much of that fall was real and how much came from the shorter collection window. But the apparent decline was at least partly driven by a comparison that should never have been treated as reliable: a complete month against an incomplete one. That comparison was Codex’s headline. Its top buying idea, a promotional set down 73.6%, rested on exactly two dated observations.
Claude had excluded June from its trend charts but still used June prices as each set’s “current price” when ranking opportunities. Once June was removed completely, two of its three top picks disappeared and its shortlist shrank from eleven sets to five.
Both tools, writing in the language of rigour, were caught by the most boring problem in analytics: an incomplete last period. Codex’s methodology even promises that “a stale observation is never shown as the latest quote”. Disclaimers are not verification. A paragraph saying you were careful is different from being careful about this.
Neither dashboard contained the most useful sentence of the whole experiment: the last month is incomplete, so don’t compare it with a full one as if they were alike. That sentence is not a chart and not a metric. It is a judgement about whether a comparison is fair, and unlike the charts, it changes what you should do next.
I want to be honest about how it was found, because it is the part of the experiment I find most interesting. I didn’t spot it by staring at a chart. I asked an AI to compare the two dashboards and to challenge a result that looked too tidy, and the AI ran the numbers. I didn’t check everything myself. I set one AI the task of questioning the work of others.
The human part was the asking.
I suspect this is where analytical work is going: less manual checking of every figure, and more designing the mechanisms that force answers to be challenged, by people and by machines, before anyone acts on them.
This is the difference I keep coming back to between an interpretation and an insight. “Prices fell 1.7% last month” is an interpretation: a true statement about the numbers as computed. “This comparison cannot reliably support the conclusion we’re drawing from it” is an insight. Less quotable, but it changes what the numbers are allowed to say. Generative AI is extraordinary at producing the first kind. The second kind starts with doubt, and doubt takes time.
Cheap to make, expensive to check
Here is the argument I want to make, and it is narrower than “AI changes everything”.
AI has collapsed the cost of producing an analytical answer that looks credible. It has not collapsed the cost of establishing whether that answer is true. In business intelligence, the second cost was always the one that mattered.
I don’t want to pretend traditional BI was rigorous by default; plenty of wrong dashboards shipped after three-week projects. But a dashboard that took three weeks to build had at least been looked at for three weeks: by the developer who found the odd join, by the stakeholder who said “that number can’t be right”. Longer development cycles created more opportunities for assumptions to be challenged. Rapid generation removes much of that incidental friction without necessarily replacing it with explicit validation. If nobody adds that validation on purpose, nobody does it.
There is an economic reason it doesn’t get cheaper. Kenneth Arrow pointed out that you can’t know what a piece of information is worth until you already have it. You can’t evaluate a dashboard by glancing at it; to check one claim, you redo part of the analysis. In my experiment the generation took about half an hour of machine time. Understanding the two outputs well enough to find one flaw took me 6 hours and an extra piece of analysis. I don’t think that ratio is an accident of this example.
And polish makes the checking harder. A slightly ugly internal report at least made you squint. A beautiful one relaxes you at exactly the moment you should be suspicious. Lisanne Bainbridge described the trap forty years ago in “Ironies of Automation”: automate the routine work and you leave people with the hardest remaining task, watching for rare failures, while giving them less practice at the work they are supposed to check. Replace “plant operator” with “analyst” and “rare failure” with “incomplete last month”, and you have a fair description of BI today.
This is also why I worry less about the number of dashboards than about their disagreement. When researchers gave 29 teams the same dataset and the same question, they reached noticeably different answers. My two dashboards are a tiny version of that: two headlines, and two top-three buying lists without a set in common. Multiply that by a hundred and the question stops being “which dashboard is best?” and becomes “who vouches for this number?”
That used to be the job of the slow parts of BI: the semantic layer, the certified dataset, the metric definition someone fought over in a meeting. In this experiment, both tools had a written note about the data’s quirks, and neither treated the incomplete month as a rule. A machine-readable flag saying June 2023 is partial would only have helped if the tools were required to respect it, and something checked that they did. Metadata quality is not documentation hygiene. It is part of the analytical contract that every AI-generated answer should be required to respect, which makes it a question of tests, enforcement and governance, not of better READMEs. Access belongs in the same sentence: shadow BI used to need a licence and a free weekend, and now it needs a prompt, often with “publish” as the default.
Maybe I won’t have to read them at all
The strongest objection to my argument deserves more than a footnote.
Maybe the flood of dashboards never comes, because dashboards stop being the interface. A dashboard was always a workaround for the cost of asking: you built the screen once so people wouldn’t have to ask an analyst every week. If asking becomes cheap, an agent can watch the data and tell me, in a sentence, the three things that changed and the one that needs a decision. Charts become evidence attached to an answer, not a place I go to look around. On that view, overload goes down.
I find this plausible. It also gives this essay’s title a second meaning: these may be dashboards I never read because something else reads them for me.
But look at what happens to the June problem in that world. It doesn’t go away. It arrives as one confident sentence, “prices softened last month across two-thirds of the range”, with no chart to make me squint and no odd count of 944 to catch my eye. The answer gets even cheaper to produce and even more credible to read, and checking it gets harder, because there is less in front of me to check. Agents don’t defeat the argument. They are its purest form.
What I would tell a BI team on Monday
The next challenge in business intelligence may not be generating answers. It may be engineering the conditions under which those answers deserve to be trusted.
None of this is an argument against these tools. I used them, and I’d use them again. A working prototype on real data exposed a data problem that no Figma mockup ever could. But the work has moved, and the plan should move with it.
- Treat every generated dashboard as a first draft from an unknown author.
- Check the boring things first: period completeness, changes in coverage, what “latest” and “current” mean. These are the bugs that write headlines.
- Put known data caveats into metadata the AI must read, not into prose someone might mention. Partial periods, aggregation type and units belong in the semantic layer.
- Audit the claims, not the charts. List every factual statement on the first screen and check each one.
- Design the challenge, not just the build. Have a second model or a second analyst question the first one’s results, and look at where they differ. Make it a step in the process, not a favour.
- Decide who signs off on meaning, not just on code. Someone has to own “is this comparison fair?”
- Budget the checking explicitly. If building took twenty minutes, verification is now the project.
Back to the library
I never did read all the books. I had to learn to make smarter choices and prioritise what was worth reading next.
What changed wasn’t my reading speed. It was how I chose: which shelves to explore, whose recommendations to trust, and which books I could leave unopened without feeling I was missing out.
Borges imagined a library holding every possible book, whose librarians spend their lives searching for the true one. Business intelligence is nowhere near that. My experiment produced two convincing prototypes in well under an hour, not a solved discipline. But it showed how quickly an answer that looks right can now be made, and the most valuable sentence was on neither dashboard. Someone had to go and ask for it: the last month is incomplete.
There will be more dashboards than I’ll ever have time to read, and I’ve made my peace with that, the way I once did with the books. The teenager in my bedroom eventually stopped counting what she would miss and started choosing what to trust. I think my profession has to learn that again. Only this time the question isn’t which ones are worth reading. It’s which ones are worth believing, and who pays to find out.